
Sports stories once depended mainly on the final score.
A team won 2–1. A batter made 90 runs. A runner crossed the line first. Those facts still matter, but modern sports coverage now asks a harder question: why did the result happen?
Data helps answer it.
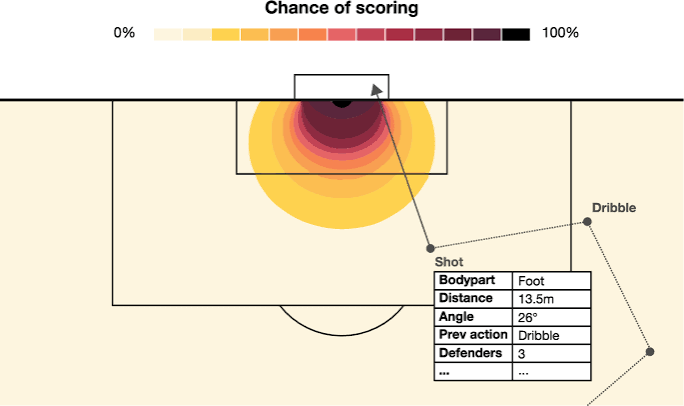
A football report can track possession, shots, expected goals, passing zones, and defensive pressure. Cricket coverage can measure strike rate, economy rate, scoring patterns, and win probability. Tennis reports can compare first-serve points, break chances, and rally length.
These numbers change the story.
A 1–0 win may look comfortable in the scoreline. Yet the data may show that the winning side created one strong chance while its opponent created ten. The result stays the same, but the reader sees the match in a different light.
Statistics also shape public expectations before and during games. Historical results, injuries, recent form, player data, prediction models, and market odds can all suggest which outcome appears more likely. None can guarantee what happens next. They turn uncertainty into a range of measurable expectations.
For journalists, this creates a new task.
The goal is no longer just to report numbers. Writers must decide which numbers explain the game and which only create noise. A useful statistic works like a good camera angle. It reveals something the basic score cannot show.
Modern sports storytelling therefore sits between two worlds: the raw event on the field and the data used to interpret it. The strongest coverage connects them without letting the numbers replace the game itself.
Data Changes Expectations Before The Match Starts
Sports data now shapes the story before the first whistle, serve, or ball.
Writers can compare recent form, injuries, home advantage, scoring rates, defensive records, and past meetings. These facts help readers see why one side enters a match with stronger expectations.
The key is context.
A team may have won five games in a row, but that record means less if all five opponents ranked near the bottom of the table. A striker may have ten goals, yet most may have come against weak defenses. Raw totals rarely tell the whole story.
Prediction models add another layer. They turn many variables into a probability. A model might give one team a 60% chance to win and another a 25% chance, with the rest assigned to a draw.
These figures do not predict the future with certainty. They describe how strong the evidence looks before the event begins.
Market odds can also reflect public expectations. The same principle applies when people see phrases such as tamasha online live casino site in wider digital content: the useful editorial question is not the platform itself, but how probability, risk, and expectation are presented to readers.
For journalists, the challenge is clear. Data should sharpen the story, not replace it.
The best pre-match coverage explains why expectations exist, which facts support them, and what could still make the result differ from the forecast.
Live Data Can Rewrite The Story In Minutes
Pre-match data creates an expectation. Live data tests it.
A strong favorite may start with more possession and territory. Yet ten minutes later, the numbers may show three shots for the underdog and none for the favorite. The match story has already changed.
This is where live statistics become useful.
Journalists can track shots, passes, turnovers, scoring rates, serve speed, or other measures as the event unfolds. These figures help explain changes that a score alone may hide.
Consider a cricket chase. A team may need 80 runs from 60 balls. Ten quiet deliveries can push the required scoring rate higher. One expensive over can reverse that pressure. The target stays fixed, but the probability of reaching it moves with each phase.
Football offers the same pattern. A red card, injury, or sudden run of chances can change statistical forecasts within minutes.
Win Probability Tells A Moving Story
Live prediction models turn these changes into updated probabilities.
A team might begin with a 65% estimated chance of winning. After conceding early, that figure may fall sharply. A later equalizer can move it again.
The percentage is not the story by itself. The movement is.
Good sports reporting connects the change to something readers can see: a goal, wicket, substitution, tactical shift, or loss of control.
This makes live data valuable because it provides structure. Instead of saying that momentum “felt different,” a writer can identify what changed on the field and show how strongly the numbers reflected that change.
Statistics Can Challenge The Final Score
The scoreboard tells readers what happened. Match statistics can show whether the result matched the pattern of play.
Imagine a football team that wins 2–0. The score suggests control. Yet its opponent may have taken 18 shots, created several clear chances, and spent most of the second half near the penalty area.
That does not make the result false. It changes its meaning.
A reporter can describe the winner as clinical rather than dominant. The losing side may have played well but failed at the final step. Data gives the writer evidence for that distinction.
The same logic works across sports.
In tennis, a player can lose despite winning more total points. A few break points may decide the match. In cricket, two batters can score similar totals while using very different numbers of balls.
Good Statistics Need Context
Numbers can also mislead when writers isolate them.
Possession offers a simple example. A football team with 65% possession did not necessarily control the dangerous areas. It may have passed the ball slowly across its own half while the opponent created better chances through quick attacks.
Strong reporting therefore connects statistics with events.
Instead of writing that one side had more possession, explain what it did with the ball. Instead of listing 15 shots, ask where those shots came from and how dangerous they were.
Data becomes useful when it explains the match rather than merely decorating the report.
Public Expectations Can Become Part Of The Story
Sports data does not stay inside newsrooms and analytics tools. Fans see it too.
Before a major match, people encounter form tables, rankings, injury reports, predicted lineups, odds, and statistical forecasts. These signals help create a shared idea of what should happen.
That expectation can shape the story after the event.
If the favorite wins with ease, the result confirms the forecast. The interesting question becomes how the team turned its advantage into control. If a heavy favorite loses, the gap between expectation and reality becomes the main story.
An upset is powerful because readers already have a reference point.
Expectations Need A Clear Source
Journalists should explain where an expectation comes from.
A team may look strong because of recent results. A model may favor it because of player quality and home advantage. Market odds may point in the same direction because many pieces of information have already affected the price.
These sources measure different things. They should not be treated as identical.
Rankings describe position. Statistics describe performance. Models estimate probability. Market odds reflect prices built around expected outcomes.
Keeping those distinctions clear makes sports coverage more precise.
It also prevents a common mistake: presenting an expected result as if it were certain. A 70% probability still leaves room for the other outcome.
That uncertainty is not a weakness in the data. It is often where the most interesting sports stories begin.
The Best Sports Stories Use Data As Evidence
Statistics work best when they support a clear point.
A weak report lists numbers without explaining them. A strong report connects each figure to something that happened during the match.
Suppose a basketball team takes 40 three-point shots. That number alone says little. The useful story asks why those shots were available. Perhaps the defense protected the paint and left space outside. Perhaps the team changed its attack after falling behind.
The statistic becomes evidence for a visible tactical choice.
The same rule applies to prediction data. A sudden change in win probability matters only when the writer explains what caused it. Readers need the event and the number together.
Select Numbers That Explain Something
More data does not always produce better reporting.
Modern sports systems can record thousands of events during one match. Publishing all of them would bury the important facts.
Journalists need to filter.
A useful statistic should answer a clear question. Did one team create better chances? Did a player perform differently from normal? Did the match change after a substitution?
This approach keeps data in its proper role.
Numbers should not become the story simply because they are available. They should help readers understand what their eyes saw, reveal patterns they may have missed, and test claims that would otherwise depend on instinct.
When writers use data this way, sports coverage becomes more precise without becoming harder to read.
Better Data Makes Sports Writing More Precise
Sports journalism has moved far beyond the final score.
Modern writers can use match statistics, live metrics, historical records, and probability models to explain what happened and why. These tools also show how expectations changed before and during an event.
Yet more numbers do not automatically create a better story.
The writer still has to choose the evidence that matters. Possession means little without context. A win probability needs the event that caused it to move. A prediction becomes useful only when readers understand the factors behind it.
The strongest reporting connects numbers to action.
A goal changes the score. Data can show whether it followed sustained pressure or came against the flow of play. A favorite can lose. Statistics can reveal whether the result was a rare shock or the product of weaknesses that appeared throughout the match.
This is where data improves sports storytelling most.
It gives writers a way to test assumptions instead of repeating them. It can challenge the obvious reading of a result and reveal patterns hidden behind a simple scoreline.
Sports will always contain uncertainty. No dataset can remove that.
But careful use of data can make the story around that uncertainty clearer, sharper, and more accurate.